
Dividend Payout Ratio Formula: Meaning, Calculation, and Sustainability
Dividend payout ratio shows what percentage of a company’s earnings is paid to shareholders as dividends. The dividend payout ratio formula helps investors understand whether a dividend is supported by profits or may be at risk. A lower or moderate payout ratio can suggest flexibility, while a very high ratio may signal sustainability concerns.
What Is the Dividend Payout Ratio?
The dividend payout ratio is a financial ratio that compares dividends paid to company earnings. It shows how much of a company’s profit is distributed to shareholders instead of being kept inside the business.
In simple terms, the dividend payout ratio answers this question: how much of the company’s earnings are being paid out as dividends?
For example, if a company earns $5 per share and pays $2 per share in annual dividends, the dividend payout ratio is 40%. This means the company pays 40% of earnings to shareholders and keeps 60% for reinvestment, debt reduction, cash reserves, or future business needs.
Dividend payout ratio is especially important for dividend investors because it helps evaluate dividend sustainability. A dividend yield may look attractive, but the payout ratio helps show whether the dividend is supported by earnings.
Dividend Payout Ratio Formula
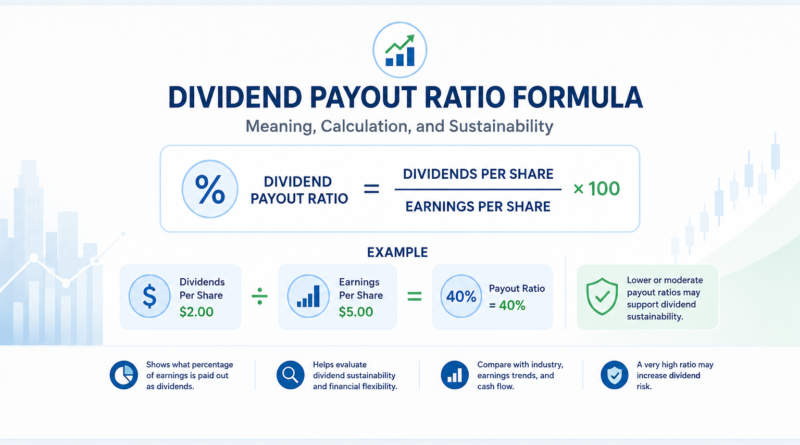
The basic dividend payout ratio formula is:
Dividend Payout Ratio = Dividends Per Share / Earnings Per Share
To express the result as a percentage:
Dividend Payout Ratio = (Dividends Per Share / Earnings Per Share) × 100
For example, if a company pays $1.50 in annual dividends per share and reports earnings per share of $5.00, the dividend payout ratio is:
Dividend Payout Ratio = ($1.50 / $5.00) × 100 = 30%
This means the company pays 30% of its earnings as dividends.
The formula dividend payout ratio can also be calculated using total dividends and net income:
Dividend Payout Ratio = Total Dividends / Net Income
Both versions aim to measure the same idea: what share of earnings is paid out to shareholders.
Dividend Payout Ratio Meaning
Dividend payout ratio meaning depends on how much profit the company distributes compared with how much it keeps.
A low payout ratio usually means the company keeps more of its earnings. This may give the business more flexibility to reinvest, reduce debt, buy back shares, or protect the dividend during weaker periods.
A high payout ratio means the company distributes a larger share of earnings. This may be attractive for income investors, but it can also reduce financial flexibility.
A very high payout ratio may be a warning sign if earnings fall, cash flow weakens, or the company needs more capital for operations.
The dividend payout ratio does not automatically say whether a dividend is good or bad. It shows how much of earnings are being paid out, and investors must interpret that number in context.
Payout Ratio Formula
The payout ratio formula is commonly used to measure the percentage of earnings paid to shareholders.
The standard payout ratio formula is:
Payout Ratio = Dividends / Earnings
For dividend stocks, this usually means:
Dividend Payout Ratio = Dividends Per Share / Earnings Per Share
If a company pays $3 per share in dividends and earns $6 per share, the payout ratio is 50%.
A 50% payout ratio means the company distributes half of its earnings and keeps the other half.
This is why payout ratio is useful for dividend analysis. It connects dividend payments with business profitability.
How to Calculate Dividend Payout Ratio
To calculate dividend payout ratio, follow three steps.
Step 1: Find Dividends Per Share
Dividends per share show how much the company pays to shareholders for each share over a specific period, usually one year.
If a company pays quarterly dividends, add the four quarterly payments together.
For example, if a company pays $0.40 per share every quarter:
Annual Dividends Per Share = $0.40 × 4 = $1.60
If a company pays monthly dividends, multiply the monthly dividend by twelve.
Step 2: Find Earnings Per Share
Earnings per share, or EPS, shows how much profit is available for each common share.
EPS is important because dividends are usually paid from earnings. If dividends are much higher than EPS, the dividend may be difficult to sustain over time.
For dividend payout ratio analysis, investors often use annual EPS.
Step 3: Divide Dividends Per Share by EPS
After finding dividends per share and earnings per share, divide dividends by EPS and multiply by 100.
For example:
Dividend Payout Ratio = ($2.00 / $5.00) × 100 = 40%
This means the company pays 40% of earnings as dividends.
Dividend Payout Ratio Calculation Example
Imagine a company reports the following numbers:
| Item | Amount |
|---|---|
| Annual dividends per share | $2.00 |
| Earnings per share | $8.00 |
| Dividend payout ratio | 25% |
The calculation is:
Dividend Payout Ratio = ($2.00 / $8.00) × 100 = 25%
This means the company distributes 25% of earnings as dividends and keeps 75% of earnings inside the business.
Now compare two companies:
| Company | Dividend Per Share | EPS | Payout Ratio |
|---|---|---|---|
| Company A | $2.00 | $8.00 | 25% |
| Company B | $2.00 | $3.00 | 66.7% |
Both companies pay the same dividend per share. But Company B has a much higher payout ratio because its earnings per share are lower.
This shows why dividend size alone is not enough. Investors need to compare dividends with earnings.
Why Dividend Payout Ratio Matters
Dividend payout ratio matters because it helps investors evaluate whether a dividend may be sustainable.
A company with a reasonable payout ratio may have room to continue paying dividends, reinvest in the business, and handle weaker periods. A company with a very high payout ratio may have less flexibility.
Investors use dividend payout ratio to analyze:
- dividend sustainability;
- earnings support for dividends;
- dividend growth potential;
- financial flexibility;
- dividend cut risk;
- income stock quality;
- long-term shareholder returns.
The ratio is especially useful when reviewed together with dividend yield, free cash flow, debt levels, and earnings trends.
Dividend Payout Ratio and Dividend Yield
Dividend payout ratio and dividend yield are related, but they measure different things.
Dividend yield compares annual dividends with the current share price. Dividend payout ratio compares dividends with earnings.
| Metric | Formula | Main Question |
|---|---|---|
| Dividend yield | Annual dividend / share price | How much income does the stock pay? |
| Dividend payout ratio | Dividend / earnings | Is the dividend supported by profits? |
A stock can have a high dividend yield but an unsafe payout ratio. This can happen when the share price falls sharply or when earnings decline.
For example, a stock may show a 7% dividend yield, which looks attractive. But if the payout ratio is 110%, the company is paying more in dividends than it earns. That can be a warning sign.
Dividend yield shows income. Dividend payout ratio helps test sustainability.
Dividend Payout Ratio and Earnings Per Share
Earnings per share is central to the dividend payout ratio formula.
If EPS rises while the dividend stays the same, the payout ratio falls. This may make the dividend look more sustainable.
If EPS falls while the dividend stays the same, the payout ratio rises. This may increase dividend risk.
For example:
| Situation | Dividend Per Share | EPS | Payout Ratio |
|---|---|---|---|
| Before EPS decline | $2.00 | $5.00 | 40% |
| After EPS decline | $2.00 | $2.50 | 80% |
The dividend did not change, but the payout ratio doubled because earnings per share declined.
This is why investors should not only look at dividend payments. They should also review earnings trends.
Dividend Payout Ratio and Free Cash Flow
Free cash flow is important because dividends are paid in cash.
A company may report accounting earnings, but if free cash flow is weak, dividend payments may be harder to sustain. Investors often compare dividends with free cash flow to see whether the business produces enough cash after operating needs and capital expenditures.
A dividend supported by both earnings and free cash flow is usually stronger than a dividend supported only by accounting earnings.
If a company pays dividends while free cash flow is consistently negative, investors should ask how the dividend is being funded. The company may be using cash reserves, debt, asset sales, or temporary financing.
That may not be sustainable over the long term.
What Is a Good Dividend Payout Ratio?
A good dividend payout ratio depends on the company, industry, business model, growth needs, and earnings stability.
There is no single perfect payout ratio for every company.
A mature company with stable cash flow may maintain a higher payout ratio. A fast-growing company may need a lower payout ratio because it reinvests more earnings into expansion.
In general, investors often prefer payout ratios that leave room for:
- reinvestment;
- debt reduction;
- dividend growth;
- economic downturns;
- earnings volatility;
- unexpected business needs.
A moderate payout ratio may suggest balance. The company rewards shareholders while still keeping enough earnings to support the business.
Low Dividend Payout Ratio
A low dividend payout ratio means the company pays out a smaller share of earnings as dividends.
A low payout ratio may suggest:
- stronger dividend flexibility;
- room for future dividend increases;
- more retained earnings;
- business reinvestment;
- lower dividend cut risk;
- conservative dividend policy.
However, a very low payout ratio is not always attractive for income investors. Some shareholders may prefer a higher dividend if the company does not have strong reinvestment opportunities.
A low payout ratio is usually positive when the company can reinvest earnings at attractive returns.
High Dividend Payout Ratio
A high dividend payout ratio means the company pays out a large share of earnings as dividends.
A high payout ratio may suggest:
- strong shareholder income;
- mature business model;
- limited reinvestment needs;
- less room for dividend growth;
- higher dividend risk if earnings fall.
A high payout ratio is not always bad. Some stable companies, such as utilities or mature dividend businesses, may operate with higher payout ratios.
But if the payout ratio is high and earnings are unstable, the dividend may be more vulnerable.
Investors should ask whether the company can maintain the dividend during weaker business conditions.
Dividend Payout Ratio Above 100%
A dividend payout ratio above 100% means the company is paying more in dividends than it earns.
For example, if a company earns $2 per share and pays $3 per share in dividends, the payout ratio is 150%.
This can happen temporarily. A company may keep paying dividends during a weak year if management believes earnings will recover.
But if the payout ratio stays above 100% for a long time, it may be a red flag. The company may be funding dividends with cash reserves, debt, or asset sales.
A payout ratio above 100% does not automatically mean a dividend cut will happen, but it does mean investors should review cash flow and balance sheet strength carefully.
Dividend Payout Ratio in Financial Ratio Analysis
Dividend payout ratio is part of financial ratio analysis because it connects shareholder payments with profitability.
It is often reviewed with other financial ratios:
| Ratio | What It Helps Analyze |
|---|---|
| Dividend payout ratio | Dividends compared with earnings |
| Dividend yield | Dividend income compared with stock price |
| Earnings per share | Profit available per common share |
| Free cash flow | Cash available after business needs |
| Debt to equity ratio | Financial leverage and balance sheet risk |
Together, these ratios help investors understand whether a dividend is attractive and sustainable.
Dividend payout ratio is not enough by itself. It should be part of a wider financial statement analysis.
Dividend Payout Ratio and Dividend Growth
Dividend payout ratio can influence future dividend growth.
If a company has a low or moderate payout ratio and growing earnings, it may have room to raise dividends. If a company already pays most of its earnings as dividends, future dividend growth may be limited.
For example, a company with a 35% payout ratio may have more flexibility than a company with a 90% payout ratio, assuming both companies have similar earnings stability.
Dividend growth investors often prefer companies that combine:
- growing earnings;
- reasonable payout ratios;
- stable free cash flow;
- conservative debt levels;
- consistent dividend history.
This combination can support long-term dividend increases.
Practical Note
A dividend payout ratio should never be judged without context. A 70% payout ratio may be normal for a stable utility but risky for a cyclical company with volatile earnings. Always compare payout ratio with industry norms, earnings stability, cash flow, and debt levels.
Common Dividend Payout Ratio Mistakes
One common mistake is assuming that a high dividend yield means a safe dividend. A high yield can be risky if the payout ratio is too high.
Another mistake is using only one year of earnings. A company may have unusually low or high earnings in a single year, which can distort the payout ratio.
A third mistake is ignoring free cash flow. Dividends are paid in cash, so cash flow support matters.
A fourth mistake is comparing payout ratios across unrelated industries. Different industries have different capital needs, earnings stability, and dividend policies.
A fifth mistake is assuming a low payout ratio always means the stock is better. A company may have a low payout ratio because management chooses not to return much cash to shareholders.
Dividend Payout Ratio Red Flags
Important dividend payout ratio red flags include:
- payout ratio above 100%;
- payout ratio rising while EPS declines;
- dividend payments exceeding free cash flow;
- debt increasing while dividends remain high;
- dividend growth continuing despite weak earnings;
- payout ratio much higher than industry peers;
- management using debt to maintain dividends;
- dividend yield rising because share price is falling sharply.
These red flags do not always mean the dividend will be cut, but they show that deeper financial statement analysis is needed.
When the Dividend Payout Ratio Can Be Misleading
Dividend payout ratio can be misleading when earnings are unusually high or low.
For cyclical companies, earnings may rise sharply during strong industry conditions and fall sharply during downturns. A payout ratio may look low near peak earnings and high during weak periods.
The ratio can also be distorted by one-time gains or losses. If net income includes unusual items, the payout ratio may not reflect normal dividend sustainability.
For companies with negative earnings, the payout ratio may not be useful. If EPS is negative but the company still pays dividends, investors should focus more on cash flow, balance sheet strength, and management guidance.
How Investors Use Dividend Payout Ratio
Investors use dividend payout ratio to decide whether a dividend looks sustainable and whether future dividend growth may be possible.
A practical payout ratio review may include these questions:
- What is the current dividend payout ratio?
- Is the ratio based on normal earnings?
- Is the payout ratio rising or falling?
- Is the dividend supported by free cash flow?
- Is EPS growing or declining?
- Is debt increasing?
- How does the payout ratio compare with industry peers?
- Has the company maintained dividends during weak periods?
This process helps investors avoid judging dividend stocks by yield alone.
Dividend Payout Ratio in Financial Statement Analysis
Dividend payout ratio belongs in financial statement analysis because dividends depend on earnings, cash flow, and financial strength.
Investors should review the income statement to understand net income and earnings per share. They should review the cash flow statement to see whether dividends are supported by cash generation. They should review the balance sheet to understand debt risk and financial flexibility.
A complete dividend review may include:
- dividend payout ratio;
- dividend yield;
- earnings per share;
- free cash flow;
- debt to equity ratio;
- profit margins;
- dividend history;
- management guidance.
This broader view helps investors understand whether dividend payments are supported by the business.
Limitations of Dividend Payout Ratio
Dividend payout ratio is useful, but it has limitations.
It does not show cash flow quality. It does not explain debt risk. It does not show whether earnings are recurring. It can be distorted by temporary earnings changes, one-time items, or accounting adjustments.
The ratio also does not show whether the company has better uses for capital. A low payout ratio may support growth if reinvestment returns are strong. But it may disappoint income investors if the company does not use retained earnings effectively.
For these reasons, dividend payout ratio should be used with other financial ratios and full financial statement analysis.
Key Takeaways
Dividend payout ratio shows what percentage of earnings is paid to shareholders as dividends.
The dividend payout ratio formula is dividends per share divided by earnings per share.
A low or moderate payout ratio may suggest dividend flexibility and room for future increases.
A high payout ratio may increase dividend risk, especially if earnings or free cash flow decline.
A payout ratio above 100% means the company is paying more in dividends than it earns.
Investors should review payout ratio together with dividend yield, earnings per share, free cash flow, debt levels, and dividend history.
FAQ
What is dividend payout ratio?
Dividend payout ratio is a financial ratio that shows what percentage of a company’s earnings is paid to shareholders as dividends.
What is the dividend payout ratio formula?
The dividend payout ratio formula is dividends per share divided by earnings per share. It can also be calculated as total dividends divided by net income.
What is the payout ratio formula?
The payout ratio formula is dividends divided by earnings. For dividend stocks, investors often use dividends per share divided by earnings per share.
What is formula dividend payout ratio?
Formula dividend payout ratio means the calculation used to measure dividends as a percentage of earnings. The formula is dividends per share divided by earnings per share, multiplied by 100.
How do you calculate dividend payout ratio?
To calculate dividend payout ratio, divide annual dividends per share by earnings per share and multiply by 100.
What does a high dividend payout ratio mean?
A high dividend payout ratio means the company pays a large share of earnings as dividends. It may provide income, but it can also reduce financial flexibility.
Is a low dividend payout ratio good?
A low dividend payout ratio can be good if it gives the company room to reinvest, reduce debt, or increase dividends later. However, it depends on how management uses retained earnings.
What does payout ratio above 100% mean?
A payout ratio above 100% means the company pays more in dividends than it earns. This may be temporary, but it can be a dividend sustainability red flag.
Why is dividend payout ratio important?
Dividend payout ratio is important because it helps investors judge whether a dividend is supported by earnings and whether future dividend growth may be sustainable.
Final Summary
Dividend payout ratio is an important financial ratio for dividend investors. It shows how much of a company’s earnings are paid out as dividends and helps evaluate dividend sustainability. The formula is simple, but interpretation requires context. Investors should review payout ratio together with dividend yield, earnings per share, free cash flow, debt levels, and financial statement analysis before judging dividend safety.