
Earnings Per Share Formula: Meaning, EPS Calculation, and Investor Use
Earnings per share is a financial ratio that shows how much company profit is available for each share of common stock. The earnings per share formula compares net income available to common shareholders with weighted average shares outstanding. Investors use EPS to evaluate profitability, business growth, valuation, and per-share earnings quality.
What Is Earnings Per Share?
Earnings per share, often shortened to EPS, measures how much profit a company generates for each common share. It is one of the most widely used financial ratios in investing because it turns total company profit into a per-share number.
A company may report millions or billions of dollars in net income, but investors usually need to know how much of that profit belongs to each share. Earnings per share helps answer that question.
EPS is commonly used in financial statement analysis, stock valuation, earnings reports, and comparisons between companies. It is also an important input in the price to earnings ratio.
EPS Formula: How Earnings Per Share Is Calculated
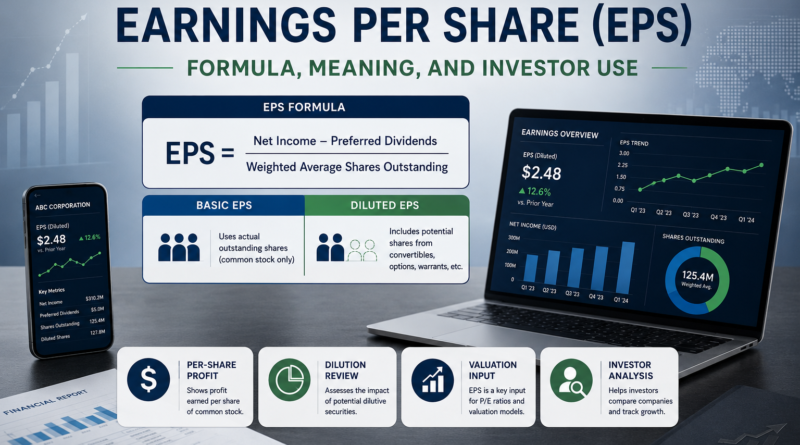
The basic earnings per share formula is:
Earnings Per Share = Net Income Available to Common Shareholders / Weighted Average Common Shares Outstanding
A simplified version is:
EPS = Net Income / Weighted Average Shares Outstanding
However, when preferred dividends exist, they should be subtracted from net income because preferred shareholders have a claim before common shareholders.
The more complete formula is:
EPS = (Net Income – Preferred Dividends) / Weighted Average Common Shares Outstanding
For example, if a company has $2,000,000 in net income, $100,000 in preferred dividends, and 950,000 weighted average common shares, its EPS is:
EPS = ($2,000,000 – $100,000) / 950,000 = $2.00
This means the company earned $2.00 for each common share.
Earnings Per Share Meaning
Earnings per share meaning is simple: EPS shows profit on a per-share basis. A higher EPS can suggest that a company is more profitable for each share, but EPS should not be judged alone.
EPS can increase because of:
- higher net income;
- lower expenses;
- stronger sales;
- share buybacks;
- fewer shares outstanding;
- improved profit margins.
EPS can decrease because of:
- lower net income;
- higher costs;
- share dilution;
- weak demand;
- restructuring expenses;
- more shares outstanding.
Investors should always ask why EPS changed. A rising EPS is stronger when it comes from real earnings growth, not only from reducing the number of shares.
EPS Meaning in Investing
EPS meaning in investing is the amount of company profit assigned to each common share. Investors use EPS to compare earnings growth, review per-share profitability, and calculate valuation ratios such as the price to earnings ratio.
How to Calculate Earnings Per Share
To calculate earnings per share, follow four steps.
Step 1: Find Net Income
Net income is found on the income statement. It shows profit after revenue, operating expenses, interest, taxes, and other costs.
For EPS, net income is the starting point because it represents the company’s final accounting profit.
Step 2: Subtract Preferred Dividends
If the company has preferred stock, subtract preferred dividends from net income. This gives net income available to common shareholders.
If the company does not have preferred stock, this step may not apply.
Step 3: Find Weighted Average Shares Outstanding
Weighted average shares outstanding represent the average number of common shares during the reporting period. This is better than using the ending share count because the number of shares can change during the year.
Shares may change because of new stock issuance, stock buybacks, stock-based compensation, conversions, or acquisitions.
Step 4: Divide Profit by Shares
After finding net income available to common shareholders and weighted average shares outstanding, divide the first number by the second.
The result is earnings per share.
Earnings Per Share Calculation Example
Imagine a company reports the following numbers:
| Item | Amount |
|---|---|
| Net income | $5,000,000 |
| Preferred dividends | $250,000 |
| Weighted average common shares | 2,500,000 |
First, calculate net income available to common shareholders:
$5,000,000 – $250,000 = $4,750,000
Now calculate EPS:
EPS = $4,750,000 / 2,500,000 = $1.90
The company’s earnings per share is $1.90. This means each common share represents $1.90 of company earnings for the period.
Basic EPS vs Diluted EPS
There are two common EPS types: basic EPS and diluted EPS.
Basic EPS uses the current weighted average common shares outstanding. Diluted EPS includes the potential effect of securities that could become common shares in the future.
These may include:
- stock options;
- restricted stock units;
- convertible bonds;
- convertible preferred stock;
- warrants.
Diluted EPS is usually lower than basic EPS because it assumes more shares could exist. More shares spread the same earnings across a larger share count.
| EPS Type | What It Uses |
|---|---|
| Basic EPS | Current weighted average common shares |
| Diluted EPS | Current shares plus potential future shares |
Investors often pay close attention to diluted EPS because it gives a more conservative view of per-share earnings.
Diluted Earnings Per Share
Diluted earnings per share shows what EPS could look like if potential shares were converted into common shares. This matters because investors want to understand possible dilution.
Dilution can reduce each shareholder’s claim on earnings. Even if net income stays the same, EPS may decline when the share count increases.
For example, if a company earns $10 million and has 5 million shares, EPS is $2.00. If potential dilution increases the share count to 6 million shares, diluted EPS becomes about $1.67.
This does not mean dilution has already happened. It means investors should understand what could happen if convertible securities or stock awards become common shares.
Why Earnings Per Share Matters to Investors
Earnings per share matters because it helps investors understand profitability on a per-share basis.
Total net income is useful, but shareholders own shares, not the entire company directly. EPS translates company profit into a number connected to each share.
Investors use EPS to evaluate:
- profitability growth;
- earnings quality;
- valuation;
- management performance;
- share dilution;
- stock price expectations;
- future earnings potential.
EPS is especially important during earnings season, when companies report quarterly or annual financial results. Analysts often compare reported EPS with expected EPS.
Earnings Per Share in Financial Ratio Analysis
Earnings per share is an important financial ratio because it connects net income with the number of shares outstanding.
EPS is often reviewed with other financial ratios, including:
| Ratio | What It Helps Analyze |
|---|---|
| Earnings per share | Profit per common share |
| Price to earnings ratio | Stock price compared with EPS |
| Return on equity | Profit generated from shareholder equity |
| Return on assets | Profit generated from total assets |
Investors may compare earnings per share with return on equity to see whether per-share profit is supported by strong shareholder returns.
EPS is useful, but it should not replace full financial statement analysis. It is one metric in a larger process.
Earnings Per Share and the Price to Earnings Ratio
Earnings per share is a key part of the price to earnings ratio, also called the P/E ratio.
The price to earnings ratio formula is:
Price to Earnings Ratio = Share Price / Earnings Per Share
For example, if a company’s stock price is $40 and its EPS is $4, the P/E ratio is:
P/E Ratio = $40 / $4 = 10
This means investors are paying 10 times earnings for the stock.
EPS helps investors understand the “earnings” part of valuation. A stock price alone does not show whether a company is expensive or cheap. Comparing price with EPS gives more context.
Earnings Per Share and Financial Statement Analysis
Earnings per share belongs in financial statement analysis because it uses information from the income statement and share data.
The income statement shows net income. Share data shows how many common shares exist during the period. EPS connects those two pieces of information.
Investors often review EPS with:
- revenue growth;
- net income trends;
- profit margins;
- cash flow;
- debt levels;
- return on equity;
- return on assets;
- share count changes.
This wider review helps prevent the mistake of treating EPS as a complete investment answer.
EPS Growth
EPS growth shows whether earnings per share are increasing over time. Many investors prefer companies with consistent EPS growth because it may signal improving profitability and business strength.
EPS growth can come from real business improvement, but it can also come from share buybacks. Buybacks reduce the number of shares outstanding, which can increase EPS even if net income does not grow much.
For this reason, investors should compare EPS growth with net income growth. If EPS is rising but total net income is flat, buybacks may be a major driver.
Strong EPS growth is more reliable when it is supported by:
- revenue growth;
- margin improvement;
- operating cash flow;
- stable or improving returns;
- disciplined share count management.
High Earnings Per Share
High earnings per share can be a positive sign, especially when it reflects strong profit generation.
High EPS may suggest:
- the company earns strong net income;
- the share count is not excessive;
- margins are healthy;
- the business has pricing power;
- management allocates capital well.
However, high EPS does not automatically mean a stock is a good investment. Investors also need to consider the stock price, growth prospects, debt risk, and cash flow quality.
A company with high EPS may still be overvalued if the stock price is too high compared with future earnings expectations.
Low Earnings Per Share
Low earnings per share may suggest weak profitability, but it does not always mean the company is poor.
Low EPS may happen because:
- the company is in an early growth stage;
- profits are temporarily pressured;
- the company has issued many shares;
- the industry is cyclical;
- the business is investing heavily;
- one-time costs reduced net income.
Investors should ask whether low EPS is temporary or structural. A company may have low EPS today but strong future potential if revenue, margins, and cash flow are improving.
Negative Earnings Per Share
Negative earnings per share means the company reported a net loss available to common shareholders. In simple terms, the company lost money on a per-share basis during the period.
Negative EPS can happen during recessions, restructuring, early growth phases, product investment periods, or difficult industry conditions.
A negative EPS is a warning sign, but the reason matters. A temporary loss from one-time charges may be different from repeated losses caused by a weak business model.
When EPS is negative, valuation metrics such as the price to earnings ratio may not be useful.
Earnings Per Share and Share Buybacks
Share buybacks can affect EPS because they reduce the number of shares outstanding. When the share count falls, the same amount of net income is divided among fewer shares.
This can raise EPS.
For example, if net income stays at $10 million but shares decline from 5 million to 4 million, EPS rises from $2.00 to $2.50.
That can be positive if buybacks are done at reasonable prices and the company has strong cash flow. But it can be less attractive if buybacks are used mainly to make EPS look better while business performance is flat.
Investors should review whether EPS growth comes from real earnings improvement or financial engineering.
Earnings Per Share and Dilution
Dilution happens when the number of shares increases. This can reduce earnings per share because profit is spread across more shares.
Dilution may come from:
- stock-based compensation;
- issuing new shares;
- convertible debt;
- convertible preferred stock;
- acquisition-related shares;
- warrants or options.
Dilution is not always bad. A company may issue shares to fund growth, strengthen the balance sheet, or acquire another business. The key question is whether the new shares help create enough future value.
Investors should compare basic EPS and diluted EPS to understand the possible effect of dilution.
Practical Note
EPS is most useful when reviewed over several years. One quarter may be affected by temporary costs, tax changes, accounting items, or unusual market conditions. Investors should look for consistent EPS trends supported by revenue, margins, cash flow, and reasonable share count management.
Common Earnings Per Share Mistakes
One common mistake is assuming EPS alone shows whether a stock is cheap or expensive. EPS must be compared with stock price, growth expectations, and risk.
Another mistake is ignoring dilution. Basic EPS may look stronger than diluted EPS because it does not include potential future shares.
A third mistake is focusing only on EPS growth without checking net income growth. EPS can rise because of share buybacks even when total earnings are not improving.
A fourth mistake is ignoring cash flow. Accounting earnings may look strong, but weak cash flow can make EPS less reliable.
Earnings Per Share Red Flags
Important EPS red flags include:
- EPS rises while revenue is flat or declining;
- EPS growth comes mainly from buybacks;
- diluted EPS is much lower than basic EPS;
- net income is positive but cash flow is weak;
- share count increases quickly;
- EPS is boosted by one-time gains;
- EPS falls for several periods without clear explanation.
These signals do not automatically mean a company is weak, but they show that deeper analysis is needed.
How Investors Use Earnings Per Share
Investors use earnings per share to evaluate company profitability, earnings growth, and valuation.
A practical investor review may include these questions:
- Is EPS growing over time?
- Is EPS growth supported by revenue growth?
- Is diluted EPS close to basic EPS?
- Is EPS supported by operating cash flow?
- Is the share count rising or falling?
- Is EPS growth recurring or temporary?
- How does EPS compare with analyst expectations?
- How does EPS affect the price to earnings ratio?
EPS becomes more useful when investors combine it with full financial analysis rather than treating it as a single decision tool.
Investors can also compare EPS with return on assets to understand whether company earnings are supported by efficient use of total assets.
Limitations of Earnings Per Share
Earnings per share is useful, but it has limitations.
EPS does not show how much cash the company generated. It does not fully explain debt risk. It does not show whether earnings are recurring. It can be affected by buybacks, dilution, accounting adjustments, one-time gains, or unusual expenses.
EPS also does not show whether a stock is fairly valued by itself. A company may have high EPS, but if the stock price is too high relative to future earnings, the investment may still be risky.
For these reasons, EPS should be used as a starting point, not a final conclusion.
Key Takeaways
Earnings per share measures how much profit is available for each share of common stock.
The earnings per share formula is net income minus preferred dividends divided by weighted average common shares outstanding.
Diluted earnings per share includes the potential effect of shares that could be created in the future.
EPS is useful for analyzing profitability, growth, dilution, and valuation.
Investors should review EPS with cash flow, revenue growth, profit margins, return ratios, share count trends, and the price to earnings ratio.
EPS should not be used alone because it can be affected by buybacks, dilution, and accounting items.
FAQ
What is earnings per share?
Earnings per share is a financial ratio that shows how much profit is available for each common share. It helps investors understand company profit on a per-share basis.
What is the earnings per share formula?
The earnings per share formula is net income minus preferred dividends divided by weighted average common shares outstanding.
How do you calculate earnings per share?
To calculate earnings per share, subtract preferred dividends from net income, then divide the result by weighted average common shares outstanding.
What does EPS mean?
EPS means earnings per share. It shows how much company profit belongs to each common share during a reporting period.
Is earning per share the same as earnings per share?
Yes. Some people search for earning per share, but the standard financial term is earnings per share. It means company profit measured on a per-share basis.
Is higher EPS better?
Higher EPS can be better when it comes from real profit growth. However, EPS can also rise because of share buybacks or a lower share count, so investors should review the reason behind the increase.
What is diluted earnings per share?
Diluted earnings per share shows EPS after including potential shares from options, convertible securities, warrants, or other instruments that could become common shares.
What is the difference between basic EPS and diluted EPS?
Basic EPS uses current weighted average common shares. Diluted EPS includes potential future shares. Diluted EPS is usually more conservative.
Why is earnings per share important?
Earnings per share is important because it helps investors evaluate profitability, earnings growth, valuation, and per-share business performance.
How is EPS used in the price to earnings ratio?
EPS is used in the price to earnings ratio by dividing the stock price by earnings per share. This helps investors compare price with company earnings.
Final Summary
Earnings per share is a core financial ratio for investors because it shows profit on a per-share basis. The EPS formula is simple, but interpretation requires context. Investors should review basic EPS, diluted EPS, earnings growth, cash flow, share count changes, and the price to earnings ratio before using EPS to judge company performance or valuation.