
Price to Earnings Ratio Formula: Meaning, P/E Calculation, and Investor Use
Price to earnings ratio is a financial ratio that compares a company’s stock price with its earnings per share. The P/E ratio formula helps investors understand how much the market is paying for each dollar of company earnings. Investors use P/E to review valuation, growth expectations, earnings quality, and market sentiment.
What Is the Price to Earnings Ratio?
The price to earnings ratio, often called the P/E ratio, compares a company’s share price with its earnings per share. It is one of the most common valuation ratios used by investors.
In simple terms, the price to earnings ratio shows how much investors are willing to pay for $1 of company earnings. If a company has a P/E ratio of 20, investors are paying 20 times the company’s earnings per share.
The price-to-earnings ratio is useful because a stock price alone does not explain whether a company looks expensive or cheap. A $100 stock may be cheaper than a $20 stock if the $100 company earns much more profit per share.
The P/E ratio adds context by connecting stock price with earnings.
Price to Earnings Ratio Formula
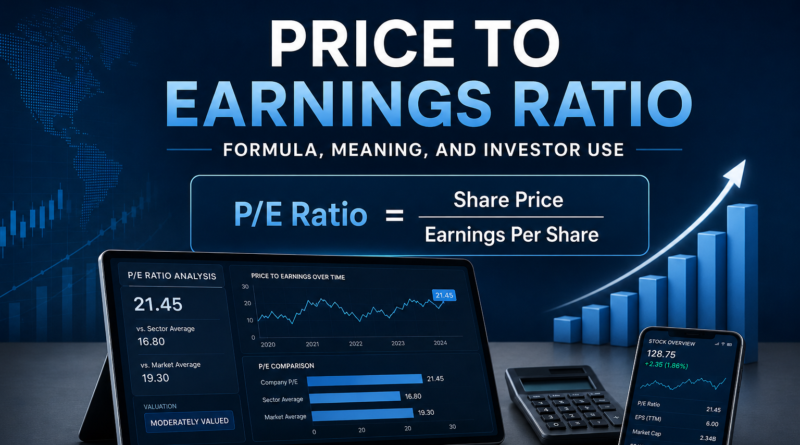
The basic price to earnings ratio formula is:
Price to Earnings Ratio = Market Price per Share / Earnings Per Share
It can also be written as:
P/E Ratio = Share Price / EPS
For example, if a company’s stock price is $60 and its earnings per share is $3, the price to earnings ratio is:
P/E Ratio = $60 / $3 = 20
This means investors are paying 20 times earnings for the stock.
The formula is simple, but interpretation requires context. A high P/E ratio may suggest strong growth expectations, but it may also suggest overvaluation. A low P/E ratio may suggest a cheap stock, but it may also signal weak earnings expectations or business risk.
Price-to-Earnings Ratio Meaning
Price-to-earnings ratio meaning depends on how investors interpret the relationship between price and earnings.
A higher P/E ratio usually means the market expects stronger future growth, higher earnings quality, or a more durable business. Investors may be willing to pay more for each dollar of earnings if they believe the company can grow profits over time.
A lower P/E ratio may mean the stock is cheaper relative to current earnings. But it can also mean investors are worried about slowing growth, falling margins, debt risk, industry pressure, or earnings instability.
The P/E ratio does not automatically tell investors whether a stock is good or bad. It only shows the market price compared with earnings per share.
How to Calculate Price to Earnings Ratio
To calculate price to earnings ratio, follow three steps.
Step 1: Find the Share Price
The share price is the current market price of one common share. This number changes during the trading day as investors buy and sell the stock.
For basic analysis, investors usually use the current share price or the closing share price.
Step 2: Find Earnings Per Share
Earnings per share, or EPS, shows how much company profit is available for each common share.
The earnings per share formula is:
EPS = (Net Income – Preferred Dividends) / Weighted Average Common Shares Outstanding
Many investors use diluted EPS because it includes potential dilution from stock options, convertible securities, and other instruments that could become common shares.
Step 3: Divide Share Price by EPS
After finding share price and EPS, divide share price by earnings per share.
The result is the price to earnings ratio.
If the stock trades at $45 and EPS is $3, the P/E ratio is:
$45 / $3 = 15
This means the market is valuing the company at 15 times earnings.
Price to Earnings Ratio Calculation Example
Imagine a company reports the following numbers:
| Item | Amount |
|---|---|
| Current share price | $80 |
| Earnings per share | $4 |
| Net income trend | Stable |
The price to earnings ratio is:
P/E Ratio = $80 / $4 = 20
This means investors are paying 20 times the company’s earnings per share.
Now compare that with another company:
| Company | Share Price | EPS | P/E Ratio |
|---|---|---|---|
| Company A | $80 | $4 | 20 |
| Company B | $40 | $1 | 40 |
Company B has a lower share price, but it has a higher P/E ratio. This shows why stock price alone can be misleading. Company B may actually be more expensive relative to earnings.
What Is a Good Price to Earnings Ratio?
A good price to earnings ratio depends on the industry, growth rate, profit stability, interest rate environment, and company quality. There is no single P/E ratio that is good for every stock.
A company with fast earnings growth may deserve a higher P/E ratio. A mature company with slow growth may trade at a lower P/E ratio. A cyclical company may look cheap during peak earnings but risky if earnings decline later.
Investors often compare P/E ratios with:
- industry peers;
- the company’s historical average;
- expected earnings growth;
- profit margin trends;
- balance sheet risk;
- cash flow quality;
- overall market valuation.
A P/E ratio is more useful when it is compared with context rather than judged alone.
High Price to Earnings Ratio
A high price to earnings ratio means investors are paying more for each dollar of earnings.
A high P/E ratio may suggest:
- strong growth expectations;
- high investor confidence;
- strong brand or competitive position;
- high earnings quality;
- durable profit margins;
- strong future earnings potential.
But a high P/E ratio can also be a warning sign. If expectations are too optimistic, the stock may be vulnerable if earnings growth slows.
A high P/E stock may fall sharply if the company misses earnings expectations, lowers guidance, or shows weaker growth than investors expected.
Low Price to Earnings Ratio
A low price to earnings ratio means investors are paying less for each dollar of earnings.
A low P/E ratio may suggest:
- the stock is undervalued;
- the market is pessimistic;
- growth expectations are low;
- earnings may be cyclical;
- investors are concerned about risk;
- the business may face pressure.
A low P/E ratio is not automatically attractive. Sometimes a stock is cheap for a reason. The company may have declining earnings, weak cash flow, heavy debt, or limited growth prospects.
Investors should ask whether the low P/E ratio reflects opportunity or business weakness.
Price to Earnings Ratio and Earnings Per Share
Earnings per share is central to the price to earnings ratio. Without EPS, the P/E ratio cannot be calculated.
The formula uses EPS as the denominator:
P/E Ratio = Share Price / Earnings Per Share
This means changes in EPS can strongly affect the P/E ratio.
If share price stays the same and EPS rises, the P/E ratio falls. If share price stays the same and EPS falls, the P/E ratio rises.
For example:
| Situation | Share Price | EPS | P/E Ratio |
|---|---|---|---|
| Before EPS growth | $60 | $3 | 20 |
| After EPS growth | $60 | $4 | 15 |
The stock may look cheaper after EPS growth if the share price does not rise at the same pace.
This is why investors review both stock price and earnings per share trends.
Trailing P/E vs Forward P/E
There are two common types of P/E ratios: trailing P/E and forward P/E.
Trailing P/E uses past earnings. Forward P/E uses expected future earnings.
| Type | Earnings Used | Main Use |
|---|---|---|
| Trailing P/E | Past EPS | Reviews valuation based on reported earnings |
| Forward P/E | Expected EPS | Reviews valuation based on future earnings expectations |
Trailing P/E is based on actual reported results, so it is more grounded in historical data. Forward P/E may be more relevant for future valuation, but it depends on estimates that can be wrong.
Investors often review both. If forward P/E is much lower than trailing P/E, the market may expect earnings growth. If forward P/E is higher, the market may expect earnings pressure.
Price-to-Earnings (P/E) Ratio in Financial Ratio Analysis
The price-to-earnings (P/E) ratio is part of financial ratio analysis, but it belongs more to valuation analysis than operational analysis.
Some financial ratios measure profitability, liquidity, leverage, or asset efficiency. The P/E ratio measures how the market values earnings.
| Ratio | What It Helps Analyze |
|---|---|
| Price to earnings ratio | Stock valuation compared with EPS |
| Earnings per share | Profit available for each common share |
| Return on equity | Profit generated from shareholder equity |
| Return on assets | Profit generated from total assets |
The P/E ratio becomes more useful when investors combine it with other financial ratios. A company with a high P/E may still be attractive if earnings growth, margins, and returns are strong. A company with a low P/E may still be risky if earnings quality is weak.
Why Investors Use the Price to Earnings Ratio
Investors use the price to earnings ratio because it gives a quick way to compare price and earnings.
The P/E ratio helps investors ask:
- Is the stock expensive compared with earnings?
- Is the market expecting strong growth?
- How does the valuation compare with competitors?
- Is the stock cheaper or more expensive than its history?
- Are earnings strong enough to support the current price?
- Is the market paying too much for future growth?
The P/E ratio is popular because it is simple. But it should be used as a starting point, not a final decision.
Price to Earnings Ratio and Growth Expectations
Growth expectations are one of the biggest reasons P/E ratios differ between companies.
A company expected to grow earnings quickly may trade at a high P/E ratio. Investors may accept a higher valuation today because they expect future EPS to rise.
A company with slow or uncertain growth may trade at a lower P/E ratio. Investors may not want to pay a high multiple if earnings are expected to stay flat or decline.
For example, a company with a P/E ratio of 35 may be reasonable if EPS is growing quickly and consistently. Another company with a P/E ratio of 10 may be risky if earnings are falling.
This is why investors often compare the P/E ratio with expected earnings growth.
Price to Earnings Ratio and Market Sentiment
The price to earnings ratio can also reflect market sentiment.
When investors are optimistic, they may pay higher P/E ratios for companies they believe will grow. When investors are cautious, P/E ratios may fall even if the company remains profitable.
Market interest rates can also influence P/E ratios. When interest rates are low, investors may accept higher stock valuations. When interest rates rise, high P/E stocks may face more pressure because future earnings become less valuable in present terms.
This does not mean the P/E ratio depends only on interest rates. Company growth, margins, risk, and earnings quality still matter.
Practical Note
The price to earnings ratio is most useful when compared with companies in the same industry. A bank, software company, utility, retailer, and manufacturer may all trade at different normal P/E ranges. Comparing unrelated industries can lead to weak conclusions.
Common Price to Earnings Ratio Mistakes
One common mistake is assuming that a low P/E ratio always means a stock is cheap. A low P/E can also signal weak growth, declining earnings, or business risk.
Another mistake is assuming that a high P/E ratio always means a stock is too expensive. A high P/E can be reasonable if future earnings growth is strong and durable.
A third mistake is ignoring EPS quality. If earnings are boosted by one-time gains, the P/E ratio may look better than the real business situation.
A fourth mistake is comparing companies from different industries without context. Different sectors often have different growth rates, margins, risks, and normal valuation ranges.
Price to Earnings Ratio Red Flags
Important P/E ratio red flags include:
- P/E ratio rises while earnings growth slows;
- EPS is boosted by one-time gains;
- forward P/E depends on overly optimistic forecasts;
- low P/E appears with declining revenue;
- earnings are positive but cash flow is weak;
- valuation is high while debt risk is increasing;
- P/E is compared across unrelated industries.
These red flags do not automatically mean a stock is bad, but they show that deeper financial statement analysis is needed.
When the P/E Ratio Does Not Work Well
The P/E ratio does not work well when earnings are negative. If EPS is negative, the P/E ratio may be meaningless or not available.
The ratio can also be misleading when earnings are temporarily high or temporarily low. Cyclical companies may look cheap near peak earnings and expensive near weak earnings, even when the stock price has not changed much.
P/E may also be less useful for early-stage growth companies that are not yet profitable. In those cases, investors may use other valuation tools, such as revenue multiples, cash flow analysis, or long-term earnings estimates.
How Investors Use P/E Ratio in Stock Analysis
A practical P/E ratio review may include these questions:
- What is the current P/E ratio?
- Is the P/E based on trailing or forward earnings?
- How does it compare with industry peers?
- How does it compare with the company’s history?
- Is EPS growing or declining?
- Are earnings supported by cash flow?
- Is the company using debt to support growth?
- Are future expectations realistic?
This process helps investors avoid treating P/E as a shortcut. A stock can look cheap by P/E and still be risky. A stock can look expensive by P/E and still perform well if earnings growth is strong.
Price to Earnings Ratio in Financial Statement Analysis
The price to earnings ratio belongs in financial statement analysis because it depends on earnings quality.
Investors should review the income statement to understand revenue, expenses, margins, and net income. They should also review the cash flow statement to see whether accounting earnings are supported by real cash generation.
The balance sheet matters too. A company with high debt may have more risk, even if the P/E ratio looks attractive.
Investors often combine P/E analysis with:
- earnings per share;
- revenue growth;
- net profit margin;
- return on equity;
- return on assets;
- free cash flow;
- debt to equity ratio.
This wider view helps investors understand whether valuation is supported by business quality.
Investors may also review dividend yield when comparing stock valuation with income potential.
Limitations of the Price to Earnings Ratio
The price to earnings ratio is useful, but it has limitations.
P/E does not show cash flow quality. It does not explain debt risk. It does not show whether earnings are recurring. It can be distorted by one-time gains, accounting changes, tax effects, share buybacks, or temporary earnings declines.
P/E also does not work well when EPS is negative. It can be misleading for cyclical companies or companies with unusual earnings.
For these reasons, the price to earnings ratio should be used with other financial ratios and full financial statement analysis.
Key Takeaways
Price to earnings ratio compares a company’s share price with earnings per share.
The price to earnings ratio formula is share price divided by EPS.
A high P/E ratio may show strong growth expectations, but it can also signal overvaluation.
A low P/E ratio may suggest a cheaper valuation, but it can also reflect weak growth or business risk.
P/E is most useful when compared with industry peers, company history, earnings growth, and cash flow quality.
Investors should not use the P/E ratio alone because it does not fully explain earnings quality, leverage, or future risk.
FAQ
What is the price to earnings ratio?
The price to earnings ratio is a financial ratio that compares a company’s stock price with its earnings per share. It shows how much investors are paying for each dollar of earnings.
What is the price to earnings ratio formula?
The price to earnings ratio formula is market price per share divided by earnings per share.
What does P/E ratio mean?
P/E ratio means price to earnings ratio. It shows how the market values a company’s earnings. A P/E ratio of 20 means investors are paying 20 times earnings.
What is price to earnings ratio meaning?
Price to earnings ratio meaning is the relationship between a company’s stock price and its earnings per share. It helps investors understand whether the market price looks high or low compared with earnings.
Is a high P/E ratio good?
A high P/E ratio can be good if it reflects strong future earnings growth. However, it can also mean the stock is expensive if expectations are too high.
Is a low P/E ratio good?
A low P/E ratio can suggest a cheaper valuation, but it can also signal weak growth, declining earnings, or business risk.
What is the difference between trailing P/E and forward P/E?
Trailing P/E uses past earnings per share. Forward P/E uses expected future earnings per share. Forward P/E depends on estimates, so it can change if expectations change.
Why is EPS important for the P/E ratio?
EPS is important because it is the denominator in the P/E formula. The P/E ratio is calculated by dividing share price by earnings per share.
Can P/E ratio be negative?
If earnings per share is negative, the P/E ratio is usually not meaningful. A negative P/E can appear mathematically, but investors usually treat it as not useful.
Final Summary
The price to earnings ratio is one of the most common valuation ratios in investing. It compares stock price with earnings per share and helps investors understand how much the market is paying for company earnings. The formula is simple, but interpretation requires context. Investors should review P/E together with EPS, growth expectations, cash flow, profit margins, debt levels, and industry comparisons before judging valuation.