
Interest Coverage Ratio Formula: Meaning, Calculation, and Debt Risk Analysis
Interest coverage ratio shows how many times a company can cover its interest expense with operating profit. The interest coverage ratio formula helps investors evaluate debt risk, financial leverage, and the company’s ability to meet borrowing costs. A higher ratio usually suggests more financial flexibility, while a low ratio may signal pressure.
What Is Interest Coverage Ratio?
Interest coverage ratio is a financial ratio that compares a company’s operating profit with its interest expense. It helps investors understand whether the company earns enough profit to pay interest on debt.
In simple terms, interest coverage ratio answers this question: how many times can the company cover its interest expense from operating earnings?
For example, if a company has operating income of $1,000,000 and interest expense of $200,000, its interest coverage ratio is 5. This means the company earns five times more operating profit than it needs to pay interest.
Interest coverage ratio is especially useful in debt risk analysis because companies with high debt may look profitable but still face pressure if interest costs become too large.
Interest Coverage Ratio Formula
The standard interest coverage ratio formula is:
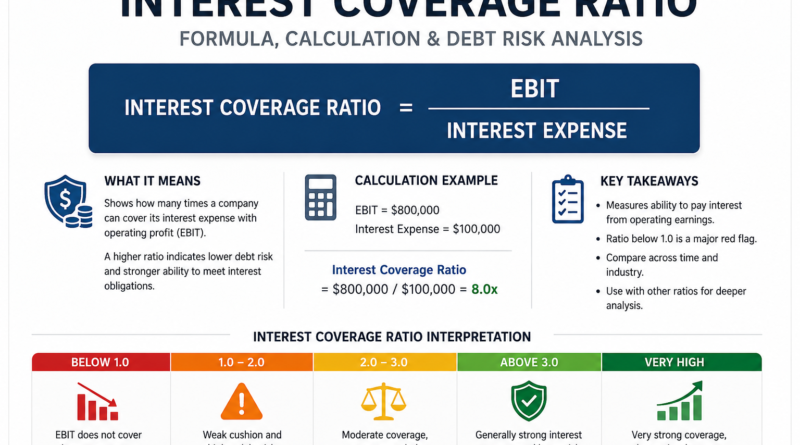
Interest Coverage Ratio = EBIT / Interest Expense
EBIT means earnings before interest and taxes. It is commonly used because it shows operating profit before financing costs and tax effects.
For example, if a company reports EBIT of $800,000 and interest expense of $100,000, the calculation is:
Interest Coverage Ratio = $800,000 / $100,000 = 8
This means the company can cover its interest expense eight times with EBIT.
A higher interest coverage ratio usually indicates stronger ability to handle interest payments. A lower ratio may suggest that interest expense is consuming too much of operating profit.
Interest Coverage Ratio Meaning
Interest coverage ratio meaning depends on how much operating profit the company has compared with interest expense.
A high interest coverage ratio means the company has more earnings available to cover borrowing costs. This may suggest lower debt risk and stronger financial flexibility.
A low interest coverage ratio means the company has less room to absorb earnings declines, rising interest rates, or unexpected business problems. If the ratio becomes too low, the company may struggle to pay interest without using cash reserves, selling assets, refinancing debt, or cutting expenses.
The ratio does not show total debt by itself. Instead, it shows whether current earnings can support current interest payments.
What Is Interest Coverage Ratio?
Interest coverage ratio is a measure of debt service capacity. It shows how comfortably a company can pay interest expense from operating earnings.
Investors, lenders, and analysts use it to review corporate debt risk. A company may have debt, but that debt may be manageable if operating earnings are strong enough to cover interest payments.
The ratio is also useful because it connects the income statement with debt risk. Interest expense appears on the income statement, and EBIT shows the company’s operating profit before interest and taxes.
Interest Cover Ratio and Interest Cover Formula
Interest cover ratio is another name for interest coverage ratio. Some investors use the shorter term “interest cover” when discussing the same idea.
The interest cover formula is:
Interest Cover Ratio = EBIT / Interest Expense
The meaning is the same as interest coverage ratio. It measures how many times operating profit covers interest expense.
For example, an interest cover ratio of 6 means the company earns six times its annual interest cost before interest and taxes.
This terminology is common in financial analysis, especially when reviewing debt-heavy companies.
How to Calculate Interest Coverage Ratio
To calculate interest coverage ratio, follow three steps.
Step 1: Find EBIT
EBIT stands for earnings before interest and taxes. It is often used as a measure of operating profit.
EBIT can sometimes be found directly in financial statements or calculated from income statement data.
A simple EBIT formula is:
EBIT = Net Income + Interest Expense + Taxes
Some companies report operating income, which may be close to EBIT depending on the reporting format. Investors should be consistent when comparing companies.
Step 2: Find Interest Expense
Interest expense is the cost a company pays on borrowed money. It may include interest on loans, bonds, credit facilities, or other debt obligations.
What is interest expense? It is a financing cost that appears on the income statement. It reduces profit because the company must pay lenders before reaching net income.
A simple interest expense formula for a loan is:
Interest Expense = Principal × Interest Rate × Time
In company financial statements, investors usually use reported interest expense rather than calculating it manually.
Step 3: Divide EBIT by Interest Expense
After finding EBIT and interest expense, divide EBIT by interest expense.
For example:
Interest Coverage Ratio = $500,000 / $100,000 = 5
This means the company can cover its interest expense five times with operating earnings.
Interest Coverage Ratio Calculation Example
Imagine a company reports the following numbers:
| Item | Amount |
|---|---|
| EBIT | $1,200,000 |
| Interest expense | $300,000 |
| Interest coverage ratio | 4.0 |
The calculation is:
Interest Coverage Ratio = $1,200,000 / $300,000 = 4.0
This means the company earns four times its interest expense before interest and taxes.
Now compare two companies:
| Company | EBIT | Interest Expense | Coverage Ratio |
|---|---|---|---|
| Company A | $1,000,000 | $100,000 | 10.0 |
| Company B | $1,000,000 | $400,000 | 2.5 |
Both companies have the same EBIT, but Company B has a lower interest coverage ratio because its interest expense is higher.
This shows why interest coverage ratio is useful. It reveals financing pressure that may not be obvious from operating profit alone.
Interest Coverage Ratio Interpretation
Interest coverage ratio interpretation depends on the company’s industry, business stability, debt level, and earnings consistency.
In general, a higher ratio is better because it suggests the company has more room to cover interest payments. A lower ratio may indicate higher debt risk.
A ratio below 1 means EBIT is not enough to cover interest expense. That is a serious warning sign because operating profit does not fully cover borrowing costs.
A ratio between 1 and 2 may suggest limited flexibility. The company can cover interest, but there may not be much cushion.
A ratio above 3 is often viewed as more comfortable, but the right benchmark depends on the industry.
| Interest Coverage Ratio | General Interpretation |
|---|---|
| Below 1.0 | EBIT does not cover interest expense |
| 1.0 to 2.0 | Weak cushion and higher debt risk |
| 2.0 to 3.0 | Moderate coverage, context needed |
| Above 3.0 | Generally stronger interest coverage |
These are general guidelines, not fixed rules.
Times Interest Earned Ratio
Times interest earned ratio is another term closely related to interest coverage ratio. In many cases, both ratios use the same formula.
The times interest earned ratio formula is:
Times Interest Earned Ratio = EBIT / Interest Expense
This ratio shows how many times a company earns enough operating profit to cover interest expense.
For example, if EBIT is $600,000 and interest expense is $150,000:
Times Interest Earned Ratio = $600,000 / $150,000 = 4
This means the company earned four times its interest cost.
The phrase “times interest earned” emphasizes the number of times earnings cover interest payments.
Times Interest Earned Ratio Meaning
Times interest earned ratio meaning is similar to interest coverage ratio meaning. It measures the company’s ability to pay interest from operating earnings.
A higher times interest earned ratio usually suggests lower short-term interest payment risk. A lower ratio suggests the company may have less ability to handle debt costs.
Investors may see both terms used in financial ratio analysis:
- interest coverage ratio;
- interest cover ratio;
- times interest earned ratio;
- time interest earned ratio.
The standard terms are interest coverage ratio and times interest earned ratio. “Time interest earned ratio” is usually a search variation, but it refers to the same concept.
Interest Coverage Ratio and Corporate Debt Risk
Interest coverage ratio is important for corporate debt risk because interest payments are mandatory. A company can delay expansion, reduce dividends, or cut discretionary spending, but it usually cannot ignore interest obligations without serious consequences.
If interest expense becomes too high compared with operating earnings, the company may face financial pressure. This can affect credit ratings, refinancing ability, investor confidence, and future growth.
Corporate debt risk increases when:
- earnings decline;
- interest rates rise;
- debt levels increase;
- refinancing becomes harder;
- cash flow weakens;
- interest coverage ratio falls.
Interest coverage ratio helps investors identify these risks early.
Interest Coverage Ratio and Financial Leverage
Financial leverage means a company uses debt to support assets, operations, or growth. Leverage can improve returns when business performance is strong, but it can increase risk when earnings weaken.
Interest coverage ratio helps show whether financial leverage is manageable.
A company with high financial leverage may still be stable if interest coverage is strong. A company with moderate debt may still be risky if earnings are weak and interest coverage is low.
Investors often review interest coverage ratio together with financial leverage ratio, leverage ratio, and debt to equity ratio. This gives a fuller view of debt risk.
Interest Coverage Ratio vs Debt to Equity Ratio
Interest coverage ratio and debt to equity ratio both help investors analyze debt risk, but they measure different things.
| Ratio | What It Measures | Main Question |
|---|---|---|
| Interest coverage ratio | EBIT compared with interest expense | Can the company cover interest payments? |
| Debt to equity ratio | Debt compared with shareholder equity | How much leverage does the company use? |
Debt to equity ratio shows the size of debt relative to equity. Interest coverage ratio shows whether earnings can support the cost of that debt.
A company may have a high debt to equity ratio but strong interest coverage if earnings are stable and interest costs are low. Another company may have lower debt but weak interest coverage if profit is declining or borrowing costs are high.
Both ratios are useful together.
Interest Coverage Ratio in Financial Ratio Analysis
Interest coverage ratio is part of financial ratio analysis because it connects profitability, debt, and risk.
It is often reviewed with other financial ratios:
| Ratio | What It Helps Analyze |
|---|---|
| Interest coverage ratio | Ability to cover interest expense |
| Debt to equity ratio | Financial leverage and capital structure |
| Debt ratio | Debt compared with total assets |
| Profit margin | Profitability after expenses |
| Free cash flow | Cash available after business needs |
Financial ratio analysis is stronger when investors review several ratios together rather than relying on one number.
Interest coverage ratio is especially useful for companies with meaningful debt, cyclical earnings, or rising borrowing costs.
Interest Coverage Ratio in Financial Statement Analysis
Interest coverage ratio belongs in financial statement analysis because the inputs come from the income statement.
Investors review EBIT to understand operating earnings and interest expense to understand financing costs. If interest expense rises faster than operating profit, the company may become more vulnerable.
A full financial statement analysis may also include:
- revenue trends;
- operating income;
- interest expense;
- net income;
- free cash flow;
- total debt;
- shareholder equity;
- debt maturity schedule.
This broader view helps investors understand whether interest coverage is stable, improving, or weakening.
What Is a Good Interest Coverage Ratio?
A good interest coverage ratio depends on the company’s industry, business model, earnings stability, and debt structure.
A stable utility or infrastructure company may operate with more debt because its cash flows may be more predictable. A cyclical company may need a stronger interest coverage ratio because earnings can fall sharply during downturns.
In general, investors prefer a ratio that provides enough cushion if earnings decline or interest rates rise.
A good interest coverage ratio should be reviewed with:
- industry norms;
- company history;
- debt levels;
- cash flow strength;
- earnings volatility;
- interest rate exposure;
- refinancing risk.
There is no single perfect number for every company.
High Interest Coverage Ratio
A high interest coverage ratio means the company has strong operating earnings compared with interest expense.
A high ratio may suggest:
- lower interest payment risk;
- stronger financial flexibility;
- manageable debt costs;
- more room for earnings volatility;
- better ability to borrow or refinance;
- stronger credit profile.
However, an extremely high interest coverage ratio does not automatically mean the company is a better investment. It may simply mean the company uses little debt.
Investors should still review profitability, growth, cash flow, and valuation.
Low Interest Coverage Ratio
A low interest coverage ratio means the company has limited operating earnings compared with interest expense.
A low ratio may suggest:
- higher debt risk;
- weak earnings cushion;
- pressure from interest costs;
- refinancing risk;
- limited financial flexibility;
- greater risk during downturns.
A low ratio becomes more concerning when earnings are declining, debt is rising, or interest rates are increasing.
Investors should look carefully at whether the company can improve earnings, reduce debt, refinance at reasonable rates, or generate enough cash flow.
Interest Coverage Ratio Below 1
An interest coverage ratio below 1 means EBIT is lower than interest expense.
For example, if EBIT is $80,000 and interest expense is $100,000:
Interest Coverage Ratio = $80,000 / $100,000 = 0.8
This means operating profit does not fully cover interest expense.
This is a major red flag. The company may need to use cash reserves, sell assets, borrow more, or rely on non-operating income to meet obligations.
A ratio below 1 does not always mean immediate default, but it signals that the company’s debt burden may be difficult to support.
Interest Expense and Interest Coverage
Interest expense is a key part of the interest coverage ratio formula. If interest expense rises while EBIT stays flat, the ratio falls.
Interest expense may rise because:
- the company borrows more money;
- floating interest rates increase;
- old debt is refinanced at higher rates;
- credit risk increases;
- debt structure becomes less favorable.
For example:
| Situation | EBIT | Interest Expense | Coverage Ratio |
|---|---|---|---|
| Before rate increase | $1,000,000 | $200,000 | 5.0 |
| After rate increase | $1,000,000 | $400,000 | 2.5 |
The company’s EBIT did not change, but interest coverage weakened because interest expense doubled.
Practical Note
Interest coverage ratio should be analyzed over several years, not just one period. A single strong year may hide debt risk if earnings are cyclical. A single weak year may overstate risk if the company normally produces stable operating profit. Trend analysis is important.
Common Interest Coverage Ratio Mistakes
One common mistake is assuming that a high interest coverage ratio means the company has no debt risk. The ratio only compares EBIT with interest expense. It does not show debt maturity, refinancing risk, or total debt burden.
Another mistake is ignoring cash flow. EBIT is an accounting measure. A company may show positive EBIT but still have weak cash flow.
A third mistake is comparing companies from unrelated industries. Some industries naturally use more debt than others.
A fourth mistake is using one year of earnings without checking whether the year was normal. Cyclical companies can look safer during strong periods and riskier during weak periods.
A fifth mistake is ignoring rising interest rates. A company with floating-rate debt may face higher interest expense later.
Interest Coverage Ratio Red Flags
Important interest coverage ratio red flags include:
- interest coverage ratio below 1;
- ratio falling over several periods;
- EBIT declining while interest expense rises;
- debt increasing faster than earnings;
- free cash flow weakening;
- refinancing risk increasing;
- interest expense growing after rate changes;
- ratio much weaker than industry peers;
- management relying on asset sales to meet obligations.
These red flags do not always mean a company will fail, but they suggest that deeper debt risk analysis is needed.
When Interest Coverage Ratio Can Be Misleading
Interest coverage ratio can be misleading when earnings are temporarily high or low.
For cyclical companies, EBIT may rise sharply during strong industry conditions and fall during downturns. The ratio may look safe near peak earnings and weak near the bottom of the cycle.
The ratio can also be distorted by one-time gains, restructuring costs, accounting changes, or unusual expenses.
Interest coverage ratio may also be less useful for companies with very low debt. If interest expense is tiny, the ratio may look extremely high but not provide much insight.
For these reasons, investors should use interest coverage ratio with financial statement analysis, cash flow review, and leverage ratios.
How Investors Use Interest Coverage Ratio
Investors use interest coverage ratio to evaluate whether a company can handle its borrowing costs.
A practical review may include these questions:
- What is the current interest coverage ratio?
- Is the ratio rising or falling?
- Is EBIT stable or cyclical?
- Is interest expense increasing?
- Does the company have floating-rate debt?
- Is free cash flow strong enough to support debt payments?
- How does the ratio compare with industry peers?
- How does it compare with the company’s history?
- Is debt to equity ratio also high?
This process helps investors avoid judging debt risk from only one number.
Limitations of Interest Coverage Ratio
Interest coverage ratio is useful, but it has limitations.
It does not show total debt. It does not show when debt matures. It does not explain cash flow quality. It does not show whether the company can refinance debt. It can also be distorted by temporary earnings changes.
The ratio also focuses on interest expense, not principal repayment. A company may cover interest but still face pressure when large debt repayments come due.
For these reasons, interest coverage ratio should be used with debt to equity ratio, debt ratio, free cash flow analysis, and full financial statement analysis.
Key Takeaways
Interest coverage ratio measures how many times EBIT covers interest expense.
The interest coverage ratio formula is EBIT divided by interest expense.
Times interest earned ratio usually uses the same formula and measures the same debt service capacity.
A high ratio usually suggests stronger ability to cover interest payments.
A low ratio may signal debt risk, especially if earnings are declining or interest expense is rising.
A ratio below 1 means EBIT does not fully cover interest expense.
Investors should review interest coverage together with financial leverage, debt to equity ratio, free cash flow, and financial statement analysis.
FAQ
What is interest coverage ratio?
Interest coverage ratio is a financial ratio that shows how many times a company can cover interest expense with EBIT.
What is the interest coverage ratio formula?
The interest coverage ratio formula is EBIT divided by interest expense.
What is interest coverage ratio meaning?
Interest coverage ratio meaning is the company’s ability to pay interest expense from operating earnings. A higher ratio usually suggests stronger ability to cover interest payments.
How do you calculate interest coverage ratio?
To calculate interest coverage ratio, divide EBIT by interest expense. For example, if EBIT is $500,000 and interest expense is $100,000, the ratio is 5.
What is interest cover ratio?
Interest cover ratio is another name for interest coverage ratio. It measures how many times operating earnings cover interest expense.
What is interest cover formula?
The interest cover formula is EBIT divided by interest expense.
What is times interest earned ratio?
Times interest earned ratio is a financial ratio that measures how many times EBIT covers interest expense. It is usually the same as interest coverage ratio.
What is the times interest earned ratio formula?
The times interest earned ratio formula is EBIT divided by interest expense.
Is time interest earned ratio the same as times interest earned ratio?
Yes. “Time interest earned ratio” is a common search variation, but the standard term is times interest earned ratio.
What is a good interest coverage ratio?
A good interest coverage ratio depends on the industry and business model. In general, investors prefer a ratio that provides enough cushion if earnings decline or interest expense rises.
What does interest coverage ratio below 1 mean?
An interest coverage ratio below 1 means EBIT is not enough to cover interest expense. This can be a serious debt risk warning sign.
Why is interest expense important?
Interest expense is important because it is the cost of borrowing. If interest expense grows too large compared with operating profit, the company may face financial pressure.
Final Summary
Interest coverage ratio is an important financial ratio for debt risk analysis. It shows how many times a company can cover interest expense with EBIT. The formula is simple, but interpretation requires context. Investors should review interest coverage together with times interest earned ratio, financial leverage, debt to equity ratio, free cash flow, and financial statement analysis before judging corporate debt risk.