
Asset Turnover Ratio Formula: Meaning, Calculation, and Efficiency Analysis
Asset turnover ratio is a financial ratio that shows how efficiently a company uses its assets to generate revenue. The asset turnover ratio formula compares net sales with average total assets. A higher ratio usually suggests stronger asset efficiency, while a lower ratio may show that assets are not being used effectively.
What Asset Turnover Measures
Asset turnover measures how much revenue a company generates for each dollar of assets. It is commonly used in efficiency analysis because it connects sales performance with the asset base used to produce those sales.
In simple terms, this ratio answers one question: how efficiently does the company use its assets to generate revenue?
For example, if a company has $2,000,000 in revenue and $1,000,000 in average total assets, the ratio is 2.0. This means the company generates $2 of revenue for every $1 of assets.
The ratio is especially useful when comparing companies in the same industry. Different industries require different asset levels, so asset efficiency should always be interpreted with business context.
Asset Turnover Ratio Formula
The standard asset turnover ratio formula is:
Asset Turnover Ratio = Net Sales / Average Total Assets
Net sales usually means revenue after returns, allowances, and discounts. Average total assets means the average value of total assets during the period.
A simple average total assets formula is:
Average Total Assets = (Beginning Total Assets + Ending Total Assets) / 2
For example, if net sales are $5,000,000 and average total assets are $2,500,000:
Asset Turnover Ratio = $5,000,000 / $2,500,000 = 2.0
This means the company generated $2 of sales for every $1 of assets.
Asset Turnover Meaning
Asset turnover meaning depends on how much revenue the company produces compared with its assets.
A high turnover level usually means the company uses assets efficiently to generate sales. This may suggest strong operational efficiency, good inventory management, productive asset use, or a business model that does not require heavy assets.
A low turnover level may suggest that the company has too many assets relative to revenue. It may also mean assets are underused, sales are weak, inventory is too high, or the business model is more asset-heavy.
The ratio does not show profitability by itself. A company can generate strong revenue from assets but still have weak profit margins. That is why investors often review asset turnover together with return on assets, profit margin, and other efficiency ratios.
Asset Turnover Formula
The asset turnover formula is another way to describe the same calculation:
Asset Turnover = Sales / Average Total Assets
Some analysts use “sales,” while others use “net sales.” In most financial ratio analysis, net sales is preferred because it removes sales returns and allowances.
The formula helps investors compare how efficiently companies turn assets into revenue.
| Company | Net Sales | Average Total Assets | Asset Turnover |
|---|---|---|---|
| Company A | $4,000,000 | $2,000,000 | 2.0 |
| Company B | $4,000,000 | $4,000,000 | 1.0 |
Company A has an asset turnover of 2.0. Company B has a turnover level of 1.0. Both companies generate the same sales, but Company A uses fewer assets to do it.
How to Calculate Asset Turnover Ratio
To calculate asset turnover ratio, follow three steps.
Step 1: Find Net Sales
Net sales are usually found on the income statement. They represent revenue after returns, discounts, and allowances.
If only revenue is shown, investors may use revenue as a practical substitute, but net sales is more precise when available.
Step 2: Find Average Total Assets
Total assets are found on the balance sheet. To calculate average total assets, add beginning total assets and ending total assets, then divide by two.
For example:
Average Total Assets = ($900,000 + $1,100,000) / 2 = $1,000,000
Using average assets is better than using only ending assets because it reflects the asset base during the full period.
Step 3: Divide Net Sales by Average Total Assets
After finding net sales and average total assets, divide net sales by average total assets.
For example:
Asset Turnover = $2,500,000 / $1,000,000 = 2.5
This means the company generates $2.50 of sales for every $1 of assets.
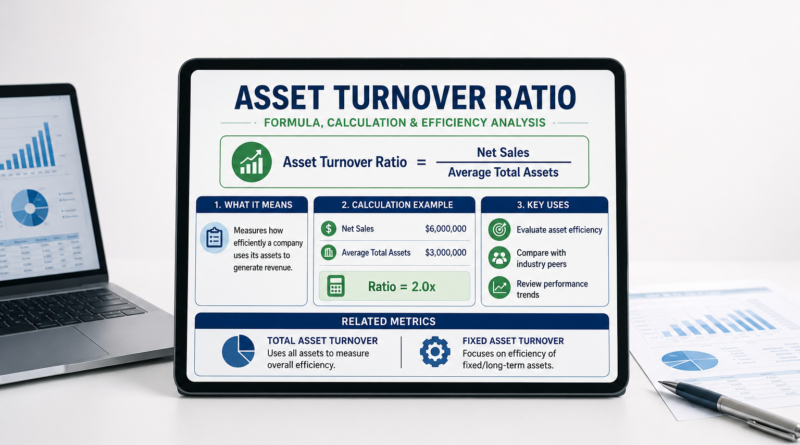
Calculation Example
Imagine a company reports the following numbers:
| Item | Amount |
|---|---|
| Net sales | $6,000,000 |
| Beginning total assets | $2,800,000 |
| Ending total assets | $3,200,000 |
First calculate average total assets:
Average Total Assets = ($2,800,000 + $3,200,000) / 2 = $3,000,000
Now calculate the ratio:
Asset Turnover = $6,000,000 / $3,000,000 = 2.0
The company generates $2 of net sales for every $1 of average total assets.
This does not automatically mean the company is profitable. It only shows asset efficiency. Investors still need to review margins, cash flow, and returns.
Total Asset Turnover
Total asset turnover is another name commonly used for the broad asset efficiency measure. It focuses on total assets rather than only one asset category.
The total asset turnover formula is:
Total Asset Turnover = Net Sales / Average Total Assets
This formula is useful because it measures the efficiency of the entire asset base. It includes current assets, fixed assets, intangible assets, and other assets reported on the balance sheet.
Total asset turnover is especially helpful for understanding how efficiently management uses the company’s full resource base to generate revenue.
Total Asset Turnover Ratio Formula
The total asset turnover ratio formula uses the same basic calculation:
Total Asset Turnover Ratio = Net Sales / Average Total Assets
For example, if a company has net sales of $10,000,000 and average total assets of $5,000,000:
Total Asset Turnover = $10,000,000 / $5,000,000 = 2.0
This means the company produces $2 of revenue for every $1 invested in total assets.
Investors often track total asset turnover over several years. A rising ratio may suggest improving efficiency. A falling ratio may suggest slower sales growth, rising asset levels, or weaker asset use.
Fixed Asset Turnover Ratio
Fixed asset turnover ratio is related to asset efficiency, but it focuses only on fixed assets.
These assets usually include property, plant, equipment, and other long-term operating assets.
The fixed asset turnover ratio formula is:
Fixed Asset Turnover Ratio = Net Sales / Average Net Fixed Assets
This ratio helps investors understand how efficiently a company uses long-term physical assets to generate sales.
For example, manufacturers, utilities, logistics companies, and industrial businesses may use large fixed asset bases. In those industries, fixed asset turnover can help show whether expensive assets are productive.
Total Assets vs Fixed Assets
Asset turnover and fixed asset turnover both measure efficiency, but they focus on different asset bases.
| Ratio | Formula | Main Focus |
|---|---|---|
| Asset turnover ratio | Net sales / Average total assets | Efficiency of all assets |
| Fixed asset turnover ratio | Net sales / Average net fixed assets | Efficiency of fixed assets |
Asset turnover gives a broader view because it includes all assets. Fixed asset turnover gives a narrower view of physical long-term assets.
A company may have strong fixed asset turnover but weaker total asset turnover if it holds large current assets, excess cash, inventory, or intangible assets.
Efficiency Ratio Analysis
Asset turnover ratio is an efficiency ratio because it measures how effectively a company uses resources to generate revenue.
Efficiency ratio analysis helps investors and managers review how well a company converts assets, inventory, receivables, or capital into business results.
| Efficiency Ratio | What It Measures |
|---|---|
| Asset turnover ratio | Sales generated from total assets |
| Fixed asset turnover ratio | Sales generated from fixed assets |
| Inventory turnover ratio | How often inventory is sold and replaced |
| Receivables turnover ratio | How efficiently receivables are collected |
This efficiency metric is one of the broadest efficiency ratios because it looks at the full asset base.
Asset Turnover and Return on Assets
Asset turnover is closely connected to return on assets. ROA measures profit generated from total assets, while asset turnover measures revenue generated from total assets.
The return on assets formula is:
Return on Assets = Net Income / Average Total Assets
Asset turnover does not include net income. It only looks at sales. Return on assets adds profitability to the analysis.
A company can improve return on assets by increasing profit margin, improving asset turnover, or both.
| Metric | What It Shows |
|---|---|
| Asset turnover ratio | How efficiently assets generate sales |
| Profit margin | How much profit remains from sales |
| Return on assets | How much profit assets generate |
This is why asset turnover is often used with profitability ratios.
Why Asset Efficiency Matters
Asset efficiency matters because it shows whether a company is using its resources productively.
A company may invest heavily in inventory, equipment, facilities, technology, or other assets. Investors want to know whether those assets are generating enough revenue.
This ratio helps analyze:
- asset efficiency;
- revenue productivity;
- management effectiveness;
- operational efficiency;
- capital intensity;
- business model differences;
- financial ratio analysis;
- return on assets drivers.
Asset turnover can also help identify whether revenue growth requires heavy asset investment. Some companies can grow sales with relatively few assets. Others need constant investment to grow.
What Is a Good Turnover Level?
A good asset turnover ratio depends heavily on the industry.
Retailers may have higher asset turnover because they sell goods quickly and may not require large fixed assets compared with revenue. Manufacturers may have lower asset turnover because they need factories, equipment, and production assets. Utilities and infrastructure companies may have even lower turnover because they operate asset-heavy businesses.
A good turnover level should be compared with:
- industry peers;
- the company’s historical trend;
- profit margin;
- return on assets;
- fixed asset turnover;
- revenue growth;
- capital expenditure needs.
There is no single good turnover level for every company.
High Asset Turnover
A high asset turnover ratio means the company generates more revenue for each dollar of assets.
A high ratio may suggest:
- efficient asset use;
- strong sales productivity;
- lean operations;
- effective inventory management;
- asset-light business model;
- better revenue generation from resources.
However, a high ratio does not always mean the company is better. A company may have high turnover but very low margins. In that case, revenue efficiency may not translate into strong profit.
Investors should compare asset turnover with profit margin and return on assets.
Low Asset Turnover
A low asset turnover ratio means the company generates less revenue for each dollar of assets.
This may suggest underused assets, weak sales, excess inventory, inefficient operations, an asset-heavy business model, or recent investment that has not yet produced revenue.
- underused assets;
- weak sales;
- excess inventory;
- inefficient operations;
- asset-heavy business model;
- recent investment not yet producing revenue.
However, a low turnover level is not always bad. Some industries require large asset bases. In other cases, a company may show lower turnover temporarily after investing in new facilities, equipment, or expansion.
The key question is whether those assets will generate future revenue growth.
Asset Turnover and Profit Margin
Asset turnover and profit margin should be reviewed together.
The turnover ratio measures revenue efficiency. Profit margin measures profitability from revenue.
A company with high asset turnover but low profit margin may generate many sales but keep little profit. By contrast, a company with lower asset turnover but high profit margin may generate fewer sales from assets but keep more profit from each sale.
| Company | Asset Turnover | Profit Margin |
|---|---|---|
| Company A | 3.0 | 3% |
| Company B | 1.0 | 15% |
Company A uses assets efficiently to generate sales, but Company B may produce stronger profit depending on the full return profile.
This is why investors should not rely on asset turnover alone.
Asset Turnover in Financial Statement Analysis
Asset turnover belongs in financial statement analysis because it uses data from both the income statement and the balance sheet.
Net sales come from the income statement. Total assets come from the balance sheet. Combining these statements helps investors evaluate how effectively assets support revenue.
A complete analysis may include:
- revenue trends;
- total assets;
- current assets;
- fixed assets;
- inventory levels;
- receivables;
- profit margins;
- return on assets;
- free cash flow.
This broader view helps investors understand whether asset efficiency is improving or weakening.
Turnover Trend Analysis
Asset turnover is often more useful as a trend than as a single number.
If the ratio rises over time, the company may be generating more revenue from the same asset base. This can suggest better efficiency, stronger demand, or improved asset management.
If the ratio falls over time, the company may be adding assets faster than revenue grows. This can happen when sales slow, inventory rises, receivables increase, or new assets are not yet productive.
Trend analysis helps investors ask better questions about management performance and capital allocation.
Practical Note
Asset turnover should be compared within the same industry. Comparing an online software business with a manufacturing company or utility can be misleading because the asset requirements are very different. The ratio is strongest when used with peers, history, profit margin, and return on assets.
Common Asset Turnover Mistakes
One common mistake is assuming a higher asset turnover ratio is always better. A high ratio can show efficiency, but it does not show profitability.
Another mistake is comparing companies from unrelated industries. Some business models naturally require more assets than others.
A third mistake is using ending assets instead of average assets. Average total assets usually gives a better view of the asset base during the period.
A fourth mistake is ignoring recent asset purchases. A company may have lower asset turnover after investing in new assets that have not yet generated full revenue.
A fifth mistake is ignoring margins. Asset turnover without profit margin can give an incomplete view of performance.
Asset Turnover Red Flags
Important asset turnover red flags include:
- asset efficiency falls for several years;
- revenue grows slowly while assets grow quickly;
- inventory rises faster than sales;
- receivables rise faster than revenue;
- fixed assets increase but sales do not improve;
- asset turnover is weak compared with peers;
- high asset turnover comes with very low profit margins;
- return on assets declines while assets expand.
These red flags do not always mean a company is weak, but they show that deeper financial analysis is needed.
When Asset Turnover Can Be Misleading
Asset turnover can be misleading when companies have very different business models.
A company with an asset-light model may naturally have a high ratio. A company with large factories, infrastructure, or regulated assets may naturally have a lower ratio.
The ratio can also be affected by accounting choices, asset age, depreciation, acquisitions, or recent capital investments.
A company that recently bought another business may show a lower ratio because assets increased before revenue synergies appeared.
For these reasons, asset turnover should be interpreted with industry context and trend analysis.
How Investors Use Asset Turnover
Investors use asset turnover to evaluate how efficiently a company turns assets into revenue.
A practical review may include these questions:
- What is the current asset turnover ratio?
- Is the ratio rising or falling?
- How does it compare with industry peers?
- Is revenue growing faster than assets?
- Are inventories or receivables increasing too quickly?
- Is return on assets improving?
- Are profit margins strong enough?
- Has the company recently made large asset investments?
This process helps investors understand whether asset growth is supporting business performance.
Limitations of the Ratio
This ratio is useful, but it has limitations.
The measure does not show profitability, cash flow quality, or the reason assets increased or decreased. It can also be distorted by acquisitions, asset sales, depreciation, or unusual revenue changes.
In addition, the ratio depends heavily on the industry. A low asset turnover level may be normal for an asset-heavy company, while a high ratio may be normal for an asset-light or retail business.
For these reasons, the turnover measure should be used with profit margin, return on assets, free cash flow, and full financial statement analysis.
Key Takeaways
Asset turnover ratio measures how efficiently a company uses assets to generate revenue.
The asset turnover formula is net sales divided by average total assets.
Total asset turnover usually means the same broad efficiency measure using total assets.
Fixed asset turnover focuses only on fixed assets.
A high ratio may suggest strong asset efficiency, but it does not prove profitability.
A low ratio may suggest weak asset use, but it may also reflect an asset-heavy business model.
Investors should review asset turnover together with profit margin, return on assets, efficiency ratios, and financial statement analysis.
FAQ
What is asset turnover ratio?
Asset turnover ratio is a financial ratio that measures how efficiently a company uses assets to generate revenue.
What is the asset turnover ratio formula?
The asset turnover ratio formula is net sales divided by average total assets.
What is asset turnover formula?
The asset turnover formula is sales or net sales divided by average total assets.
What is total asset turnover?
Total asset turnover measures how much revenue a company generates from its total asset base. It is commonly used as another name for asset turnover ratio.
What is the total asset turnover formula?
The total asset turnover formula is net sales divided by average total assets.
What is fixed asset turnover ratio?
Fixed asset turnover ratio measures how efficiently a company uses fixed assets to generate sales. It uses net sales divided by average net fixed assets.
What is fixed asset turnover ratio formula?
The fixed asset turnover ratio formula is net sales divided by average net fixed assets.
How do you calculate asset turnover ratio?
To calculate asset turnover ratio, divide net sales by average total assets. Average total assets can be calculated by adding beginning and ending total assets and dividing by two.
Is a high asset turnover ratio good?
A high asset turnover ratio can be good because it may show efficient asset use. However, investors should also check profit margin and return on assets.
How is asset turnover related to return on assets?
Asset turnover shows how efficiently assets generate revenue. Return on assets shows how efficiently assets generate profit. Both ratios help evaluate business performance.
Final Summary
Asset turnover ratio is an important efficiency ratio that shows how well a company uses assets to generate revenue. The formula is net sales divided by average total assets. The ratio is most useful when compared with industry peers, company history, profit margin, and return on assets. Investors should use asset turnover as part of broader financial ratio analysis rather than as a standalone conclusion.